Panels
During full compilation Hydra collects metrics about where compilation time is spent. All collected metrics are automatically pushed to the configured dashboard service and can be easily inspected via the web-based dashboard.
Deck
The Deck provides a quick glance at how your project is performing, the amount of time you spend compiling and the average compile speed.
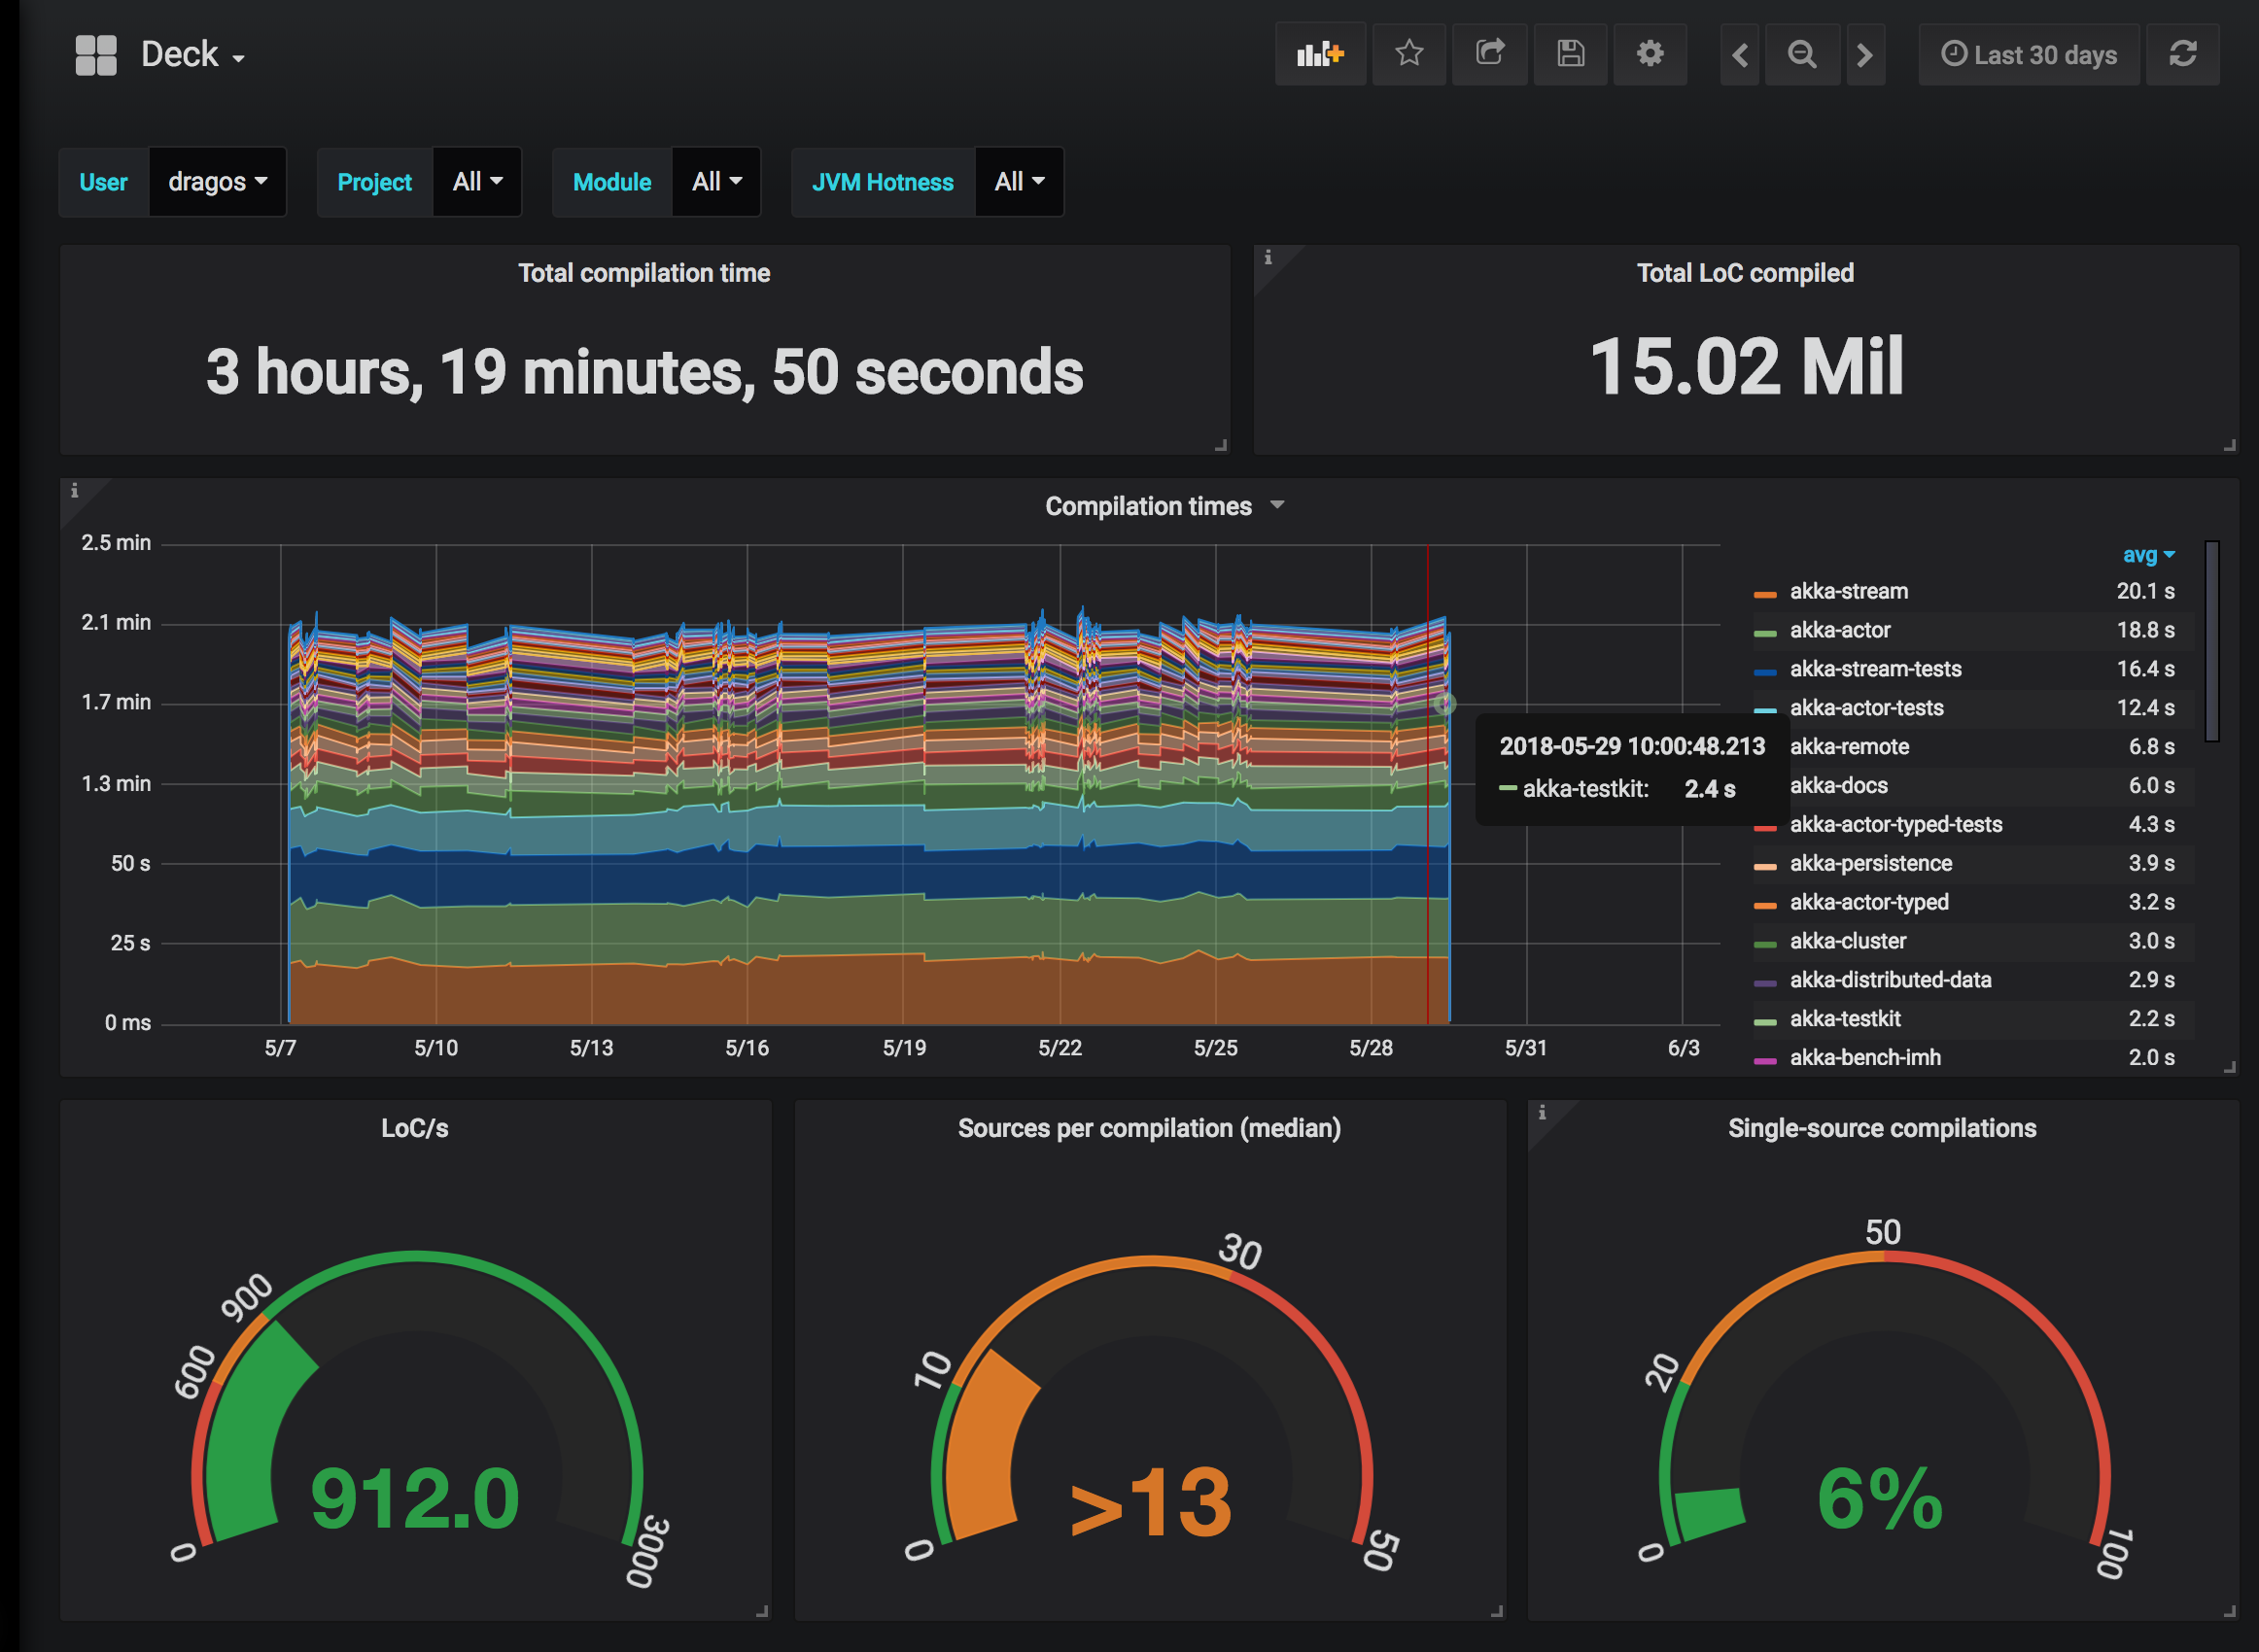
At the top you can control the data that you see by selecting the user, project and module (you can select more than one project at a time).
The first row gives an idea of the time you spent compiling by summing up all compilation events, as well as the amount of code (as lines of code) you compiled in the selected time window.
The largest row plots compile times for all selected projects and submodules. The "heaviest" projects are at the bottom, and you can show a single series by clicking on the Legend on the right.
The bottom row shows a few performance metrics:
LoC/s: average compilation speed across all selected projects, as lines of code per second (excluding comments or whitespace).Sources per compilation (median): This shows the median number of sources compiled together, across the selected time window. In the screenshot above we can read that 50% of compilation events had more than 13 files. This gives an idea about the efficiency of incremental compilation, as you'd expect a lower number if the project benefits a lot from it.Single-source compilations: The percentage of compilation events where a single source file was compiled.
To navigate to the next dashboard you can use the top-left info button in the Compilation Time panel, or click on the drop-down a the top of the page and select Trends.
Trends
The Trends dashboard gives you an birds eye overview of your project and its evolution.
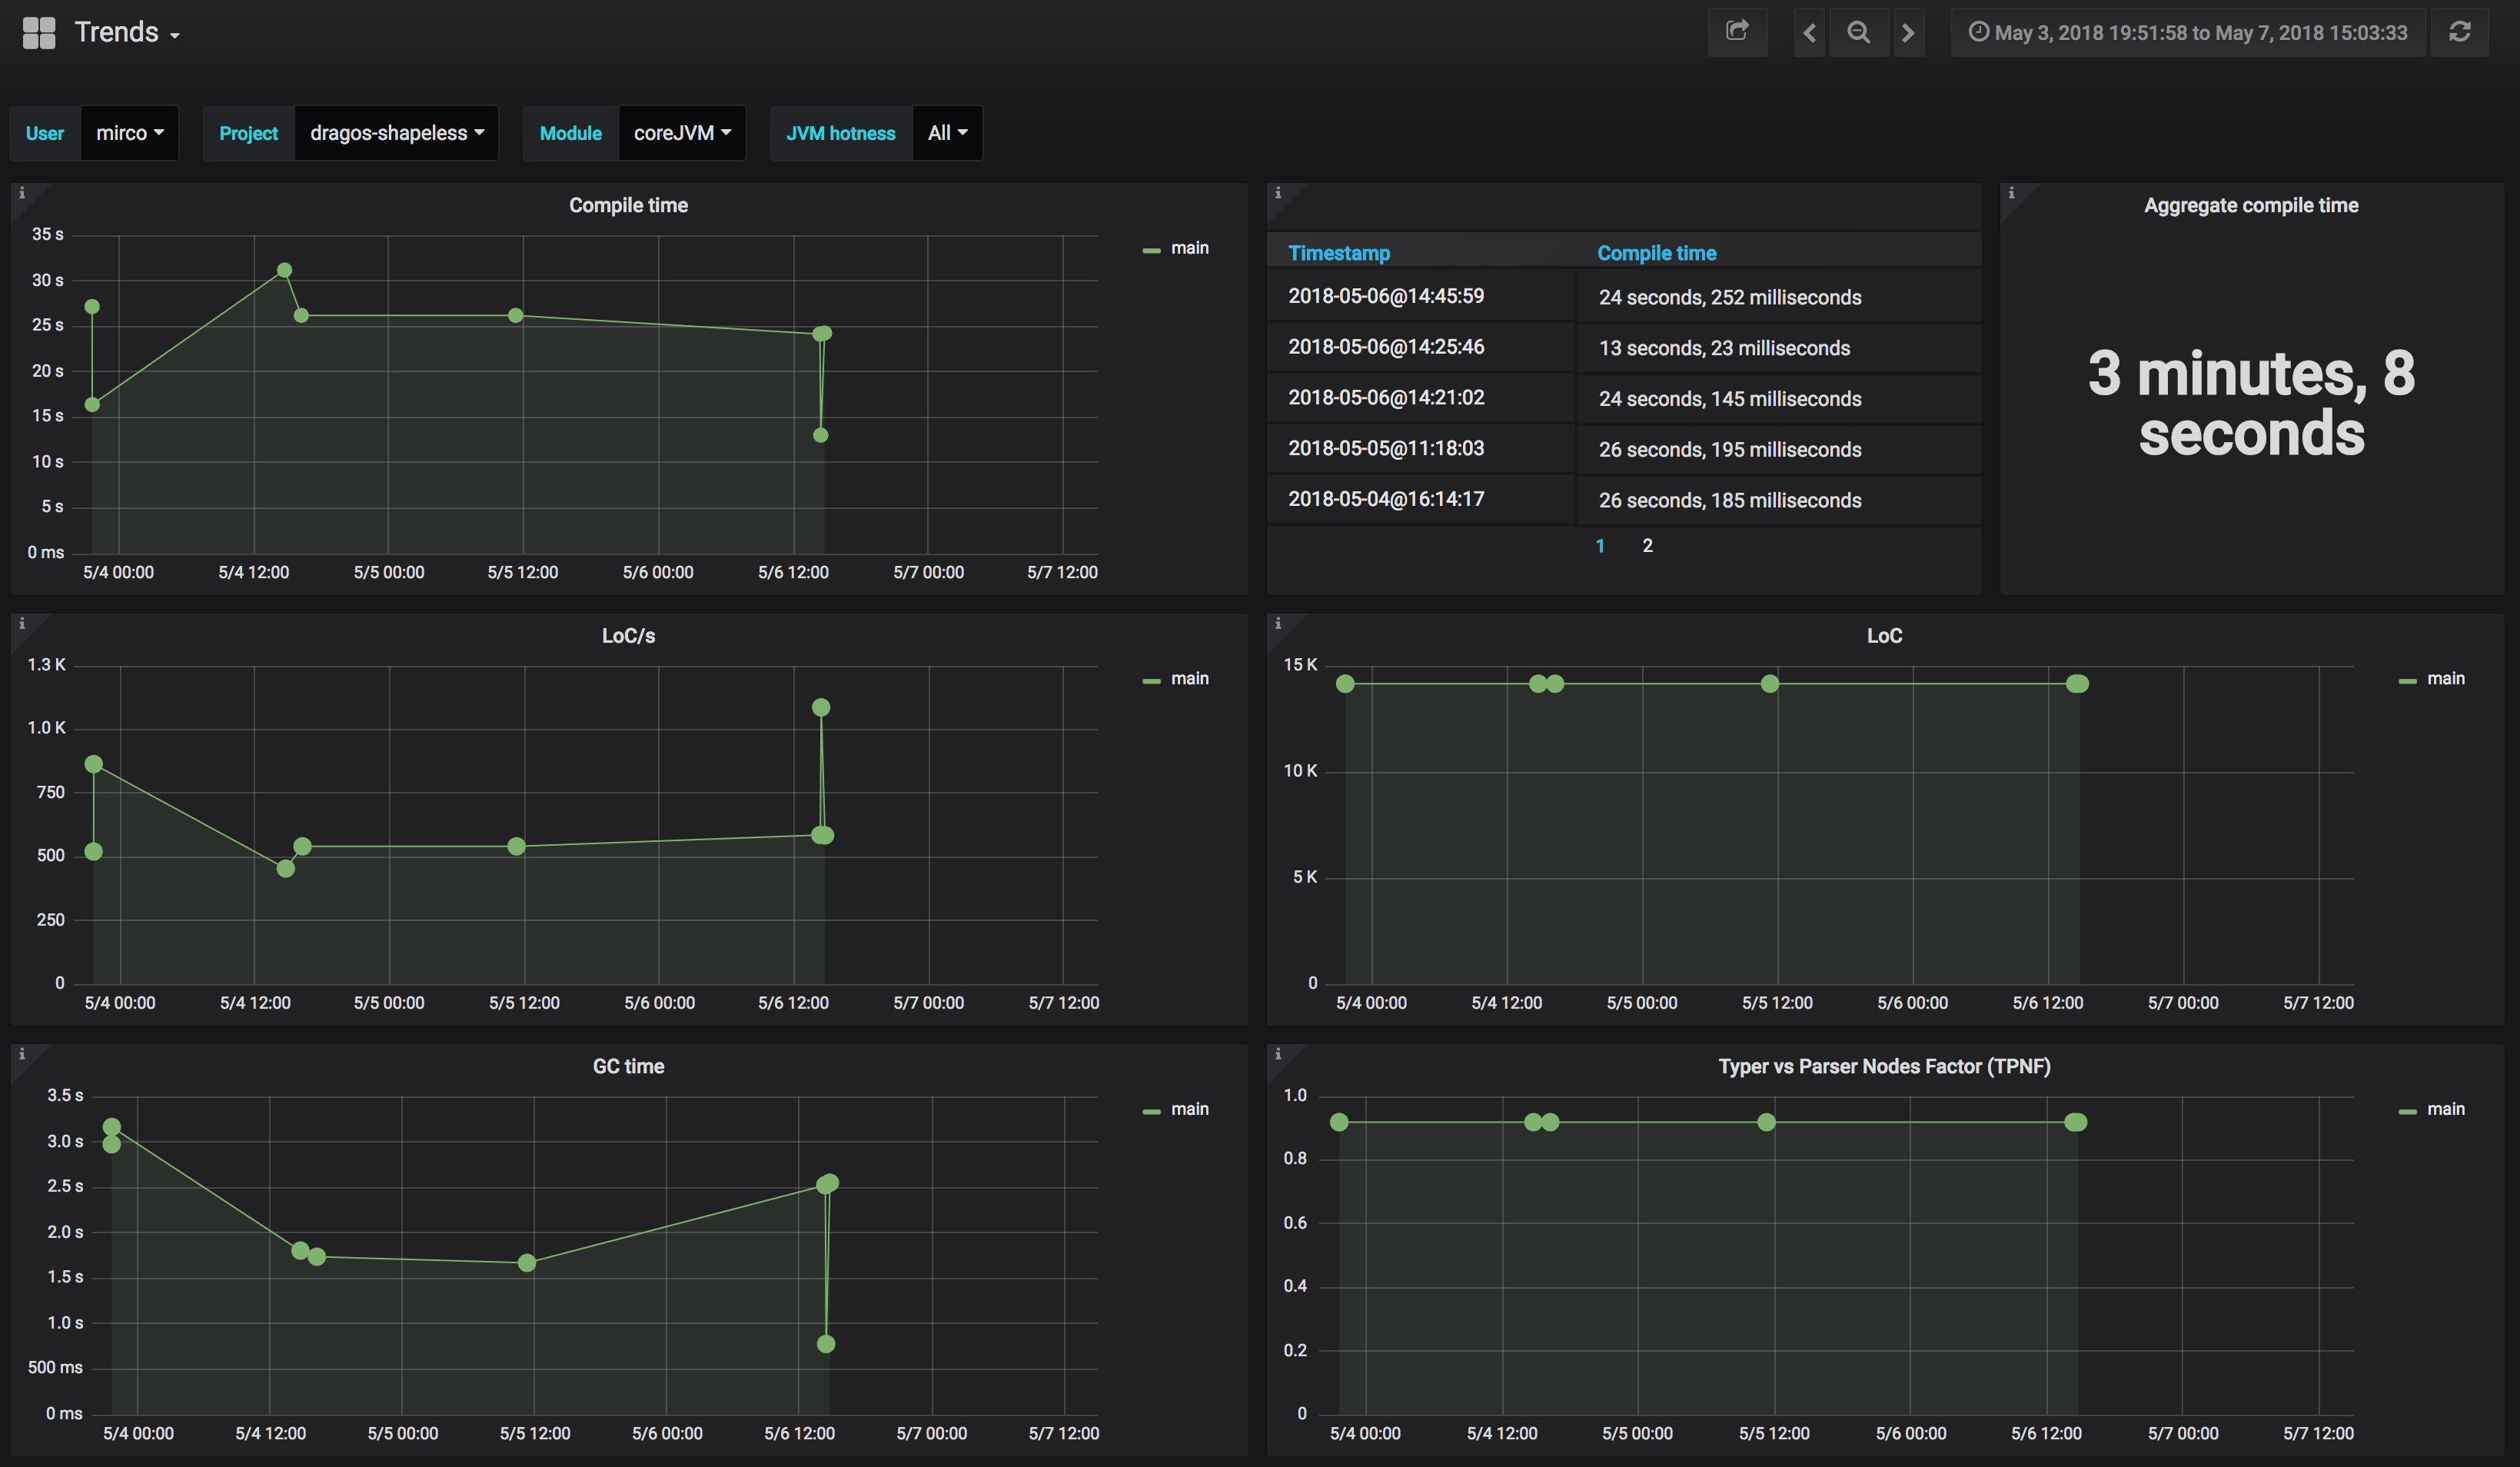
In the top-left there are four different variables that filter the compilation data to display:
User: Each users pushes data under its own namespace. Just make sure that users don't share the same name.Project: The set of projects for which compilation metrics exist. The name of the project usually matches the folder name where the project was cloned.Module: A project may contain several modules, hence each module compilation metrics is conveniently separated.JVM hotness: Compilation is usually considerably slower on a "Cold" JVM than on a "Warm JVM". This filter allows you to focus your attention on the compilation data is the most meaningful to you.
Also, note that in the top-right corner it's possible to change the time filter for the displayed data.
Next follows a description of the purpose of each panel:
-
Compile time: Displays the project's compile time evolution. The table next to it allows you to dig into each compilation event. Click on a timestamp and a new tab opens with detailed information about worker and unit metrics. This is referred to as the Insights dashboard. -
Aggregate compile time: Total time spent compiling for the selected time window. -
LoC/s: Compilation speed in Lines of Code per second excluding comments and white space. Typical values range between 500 LoC/s (for heavy macro or type-intensive code) and 2000 LoC/s, depending on project code style and Scala version. -
LoC: Lines of Code per second excluding comments and white space. -
GC time: Time spent doing garbage collection while compiling. High GC time is a common reason for suboptimal compile time. If so, increase the heap memory given to compile the project. -
Typer vs Parser Nodes Factor (TPNF): The number of tree nodes after typechecking divided by the number of tree nodes after parsing. A large number of typer nodes compared to parser nodes usually indicates that there is a lot of macro expansion happening. This impacts compilation times in two ways: type-checking takes longer, and subsequent phases have a lot more code to generate. -
"Sources count": Number of compiled Scala source files.
Insights
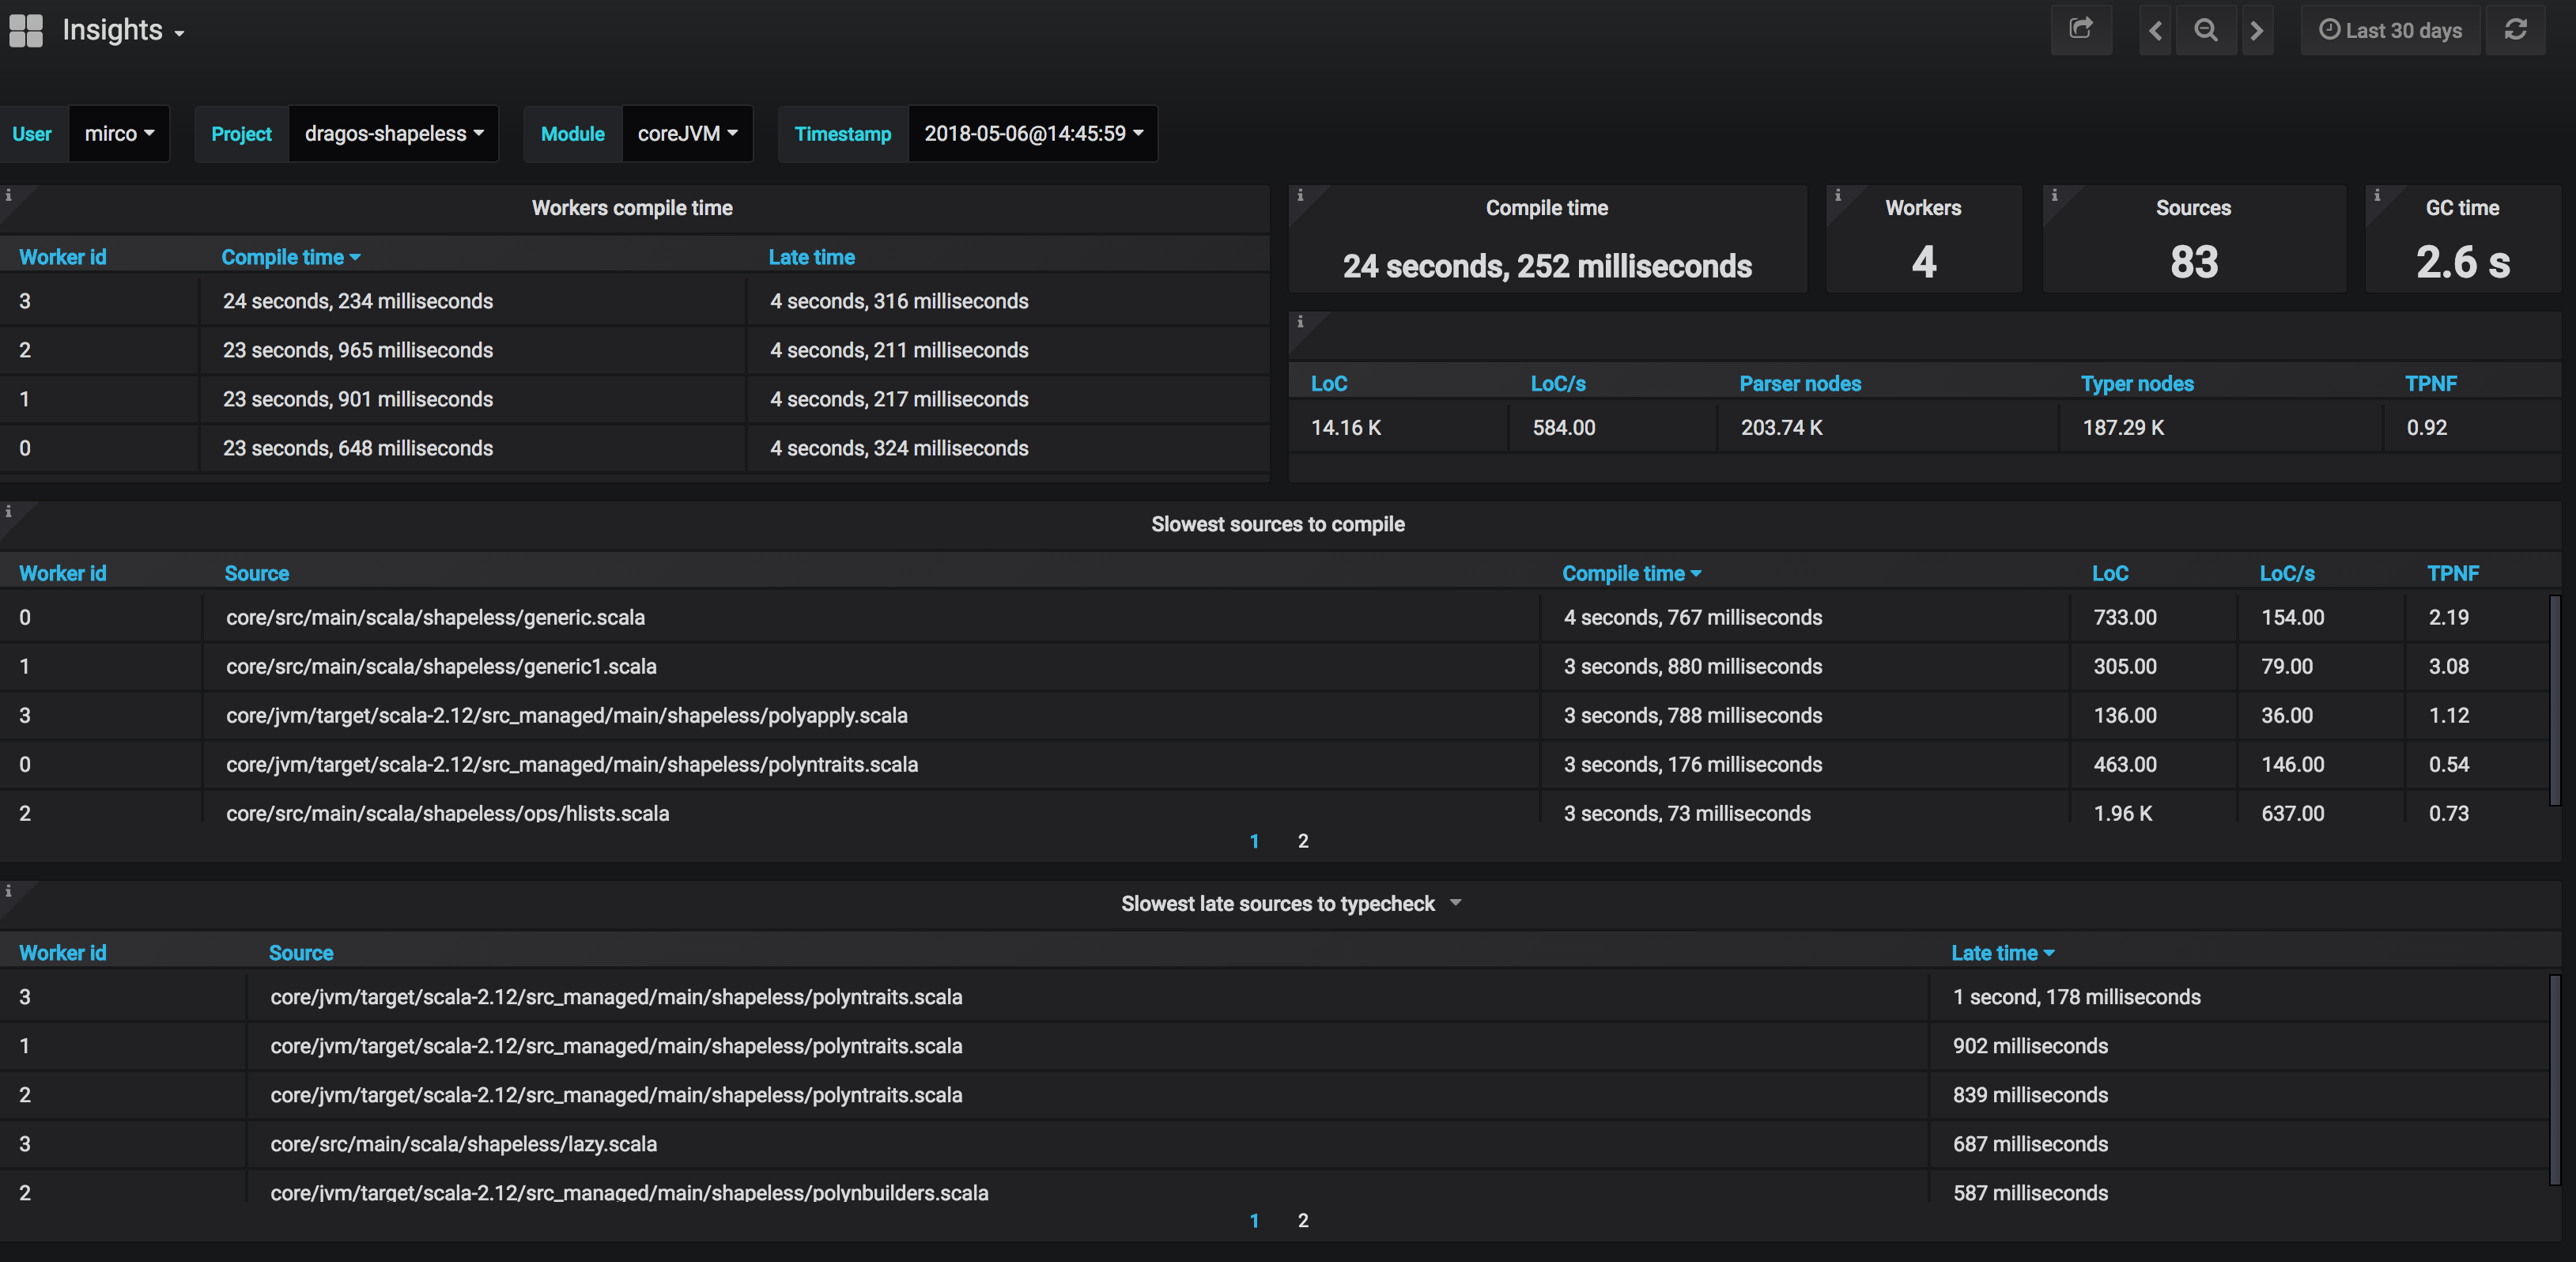
While the Trends dashboard provides an overview of the project health, when compile times get suspiciously high, it's good to understand why that is the case. An additional dashboard named Insights is available exactly to help you with this task. To open the Insights dashboard, just click on the "Timestamp" value (in the table next to the "Compile time" chart) and the dashboard below will open on a new tab.
-
Workers compile time: The time each worker takes to compile its sources. Workers compilation time should be fairly balanced. If they aren't, there is an opportunity to improve your overall compile time! Read detect compile time inefficiencies to understand how to improve compile time. -
Compile time: The time it took to compile all sources. The reported time will be very close (if not identical) to the compile time of the slowest worker. -
Workers: Number of workers used to compile all sources. -
Sources: Number of compiled Scala source files. -
GC time: Time spent doing garbage collection while compiling. High GC time is a common reason for suboptimal compile time. If so, increase the heap memory given to compile the project. -
LoC, LoC/s, Parser nodes, Typer nodes, TPNF: Relates quantities such as Lines of Code (LoC) and tree nodes to compilation throughput (LoC/s) and tree nodes explosions usually caused by macro expansions (TPNF - Typer vs Parser Nodes Factor). -
Slowest sources to compile: Shows the sources that took the most time to compile. This is the most useful information to help you detect compile time inefficiencies. -
Slowest late sources to typecheck: "Late sources" are source dependencies of a worker. In a nutshell, a worker is assigned a set of sources X to compile, but the sources in set X might depend on sources that are not in X. These additional dependencies are referred to as late sources. Late sources need to be typechecked by a worker to successfully compile the sources it was assigned to (i.e., the X set of sources we mentioned before). The additional typechecking due to these late sources decrease the overall throughput of parallel compilation (as formalized by Amdahl's law). Therefore, by reducing the late time of the slowest sources, the overall compile time will also decrease. One simple way to decrease the reported late sources typechecking time is to add explicit return types to members that are costly to compute (e.g., implicit values computed via macros, which can happen often if you are using circe automatic derivation or similar libraries that use macros to reduce boilerplate). -
Generic info: Reports versions and build information.
Next read Metrics service to understand how metrics are collected and pushed to the dashboard.