Tuning Parallelism
Parallelizing the compiler is not a panacea: running a parallel load at optimal performance may still require tuning. In this section we look at a few common scenarios and what you can do about it.
The Dashboard gives you the tools necessary to find out when compilation is not optimal and where to focus your attention. The Trends view gives an overview of compilation times over time, but the real power comes with the Insights view.
Unbalanced workers
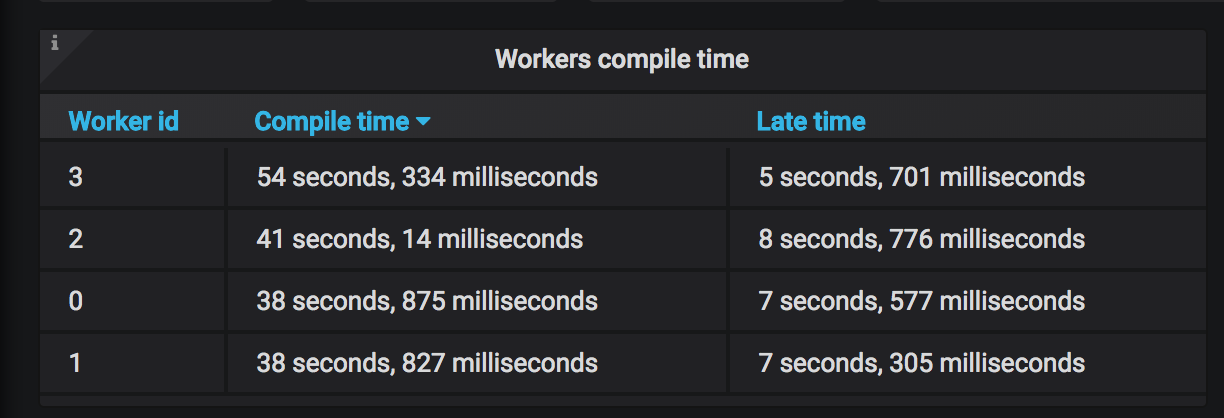
In order for parallel compilation to perform well workers need to be doing roughly the same amount of work. You can see this in the Workers compilation time panel of the Insights dashboard.
Hydra constantly watches the workload of each worker and when it detects an unbalance it will attempt to rebalance the load. When that happens, you may see the following message when a project is compiled in the hydra.log file:
[info] An automatically balanced partition file has been created in <project-dir>/.hydra/<build-tool>/<module>/compile/partition.hydra. It will be used by subsequent builds.
What happened? The first time a full compile is carried out, Hydra assigns an equal number of source files to each worker. This works well as long as each source file takes roughly the same amount of time to compile. However, it may happen that a few files take a lot more time than others (maybe due to costly macros or implicit search), and that leads to unbalanced loads between workers. When this situation occurs, Hydra generates a partition.hydra file (located under .hydra/<build-tool>/<module>/<configuration>).
The generated partition file is created using the individual compilation time of each source file, with the goal of having an optimal workload among workers. Hydra will use the generated partition file for the next compile. As the JVM warms up, compile time may change and a new balancing round may be necessary. In a nutshell, the message above is just telling you that Hydra is automatically tuning itself to deliver the best compilation time!
Currently, there are however two limitations with this approach:
-
the partition file generated when the JVM is warm may still lead to unbalanced workers when the JVM is cold (the JVM is cold every time you quit and re-enter the sbt interactive shell, or when you do a
reload- protip: try hard to never quit the interactive sbt shell). This is not a big issue, as Hydra will automatically tune itself. -
the automatic tuning behavior won't help you achieve the best speed up on your Continuous Integration (CI) server, as on the CI only a single build is executed, and hence there is no opportunity for the automatic tuning behavior to kick in (or rather, to pay off). Consequently, if you see the above message and want the CI build to compile as fast as your local builds, you'll need to use the
"explicit"source partition strategy. Read how on the related Continuous Integration page.
The partition file format
The format of the partition file is one source file name per line, with a blank line between partitions. Source files are relative to the project's root so that you can freely share the partition file across team's members.
# worker 0
src/main/scala/file1.scala
src/main/scala/file2.scala

# worker 1
src/main/scala/file3.scala
src/main/scala/file4.scala
Each partition is assigned to a worker, so make sure the number of partitions in the partition file is equal to the value set for hydraWorkers.
NOTE Don't move
package.scalafiles between workers. Package objects in Scala require special treatment, and moving them between workers may lead to compilation errors.NOTE Hydra tries to be forgiving: if the number of partitions is smaller than
hydraWorkersit will continue. However, it will refuse to use more thanhydraWorkerseven when the partition file says so.
Incremental compiles
Make sure your partition file contains all the files in your project. If Hydra receives files that aren't found in the partition file it will fall back to the "auto" partition strategy. This will be logged in hydra log file.
Choosing the number of workers
Hydra tries to choose a reasonable default number of workers, but depending on your hardware, you might need to increase or decrease this number. As a rule of thumb, start with a number of workers around half the number of cores (so, for most laptops today, that would be 4).
- decrease the number of workers if you notice that each worker gets a small number of files for a clean build, or the worker execution time is very small
- increase the number of workers otherwise, and as long as you notice speed improvements
The Scala Compiler uses a lot of memory, and having several workers on your machine may hit the limits of the memory bus. In other words, the load may become "memory-bound", and no matter how many spare cores you have you won't notice improvements.
Desktop and server-grade hardware have better memory performance, so don't be shy to push your system to the limits.
Detecting compile time inefficiencies
Unexpected interactions between macros and implicit search can lead to an exponential growth of compilation time, and it is usually difficult to understand if the long compile time is symptomatic of a deeper problem. One of the most useful bits of information to understand why compilation is taking longer than expected is to know which sources are taking the most to compile. Quite simply, having the individual sources compilation times helps you focus your efforts on the problematic sources.
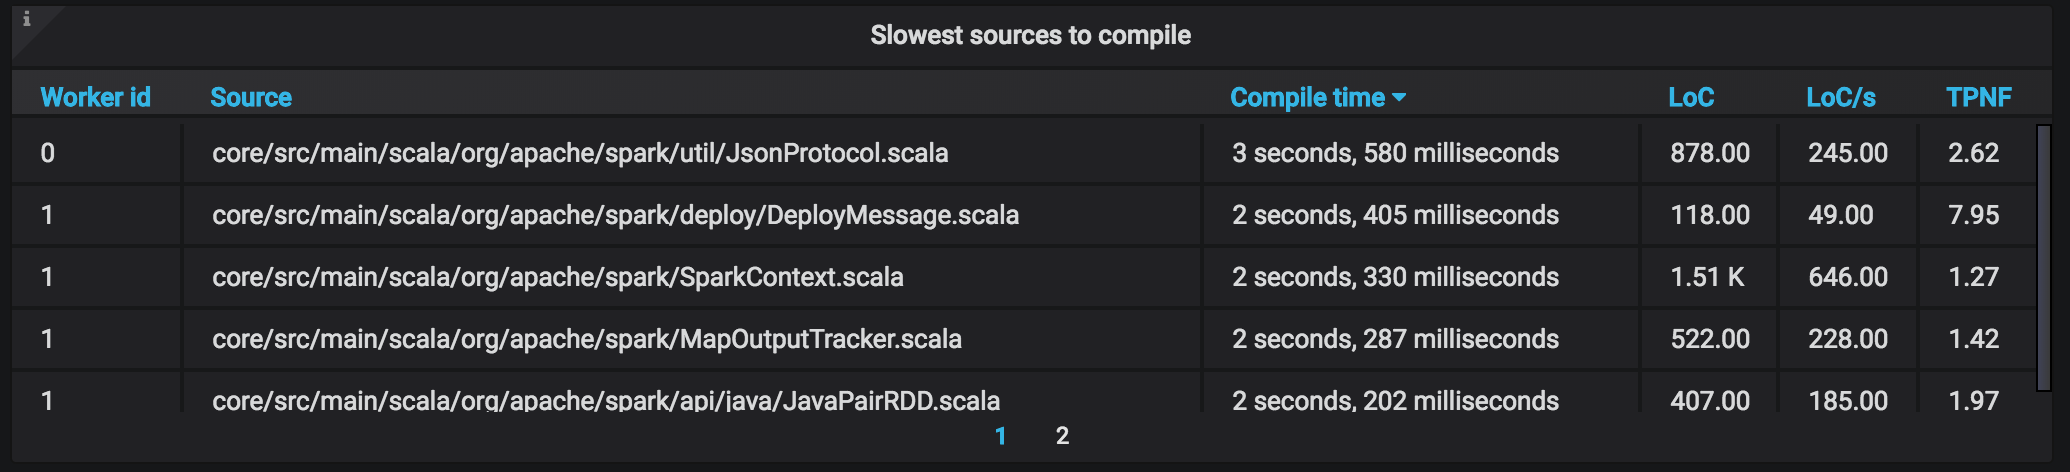
The Insights view shows you the slowest source files to compile, and lists a couple of data points about each:
- Compilation time
- Lines of Code (LoC) excluding comments and white space
- Speed in LoC/s
- TPNF: the ratio between the size of parsed Scala code and type-checked Scala code
The last point deserves a small discussion. The Scala compiler expands macros during type-checking. Sometimes the code size increases many folds, and that usually spells trouble: besides additional type-checking time, the additional code needs to go through all the other phases of Scala compilation, all the way to byte code on disk. A high TPNF number (Typer-Parser Node Factor) indicates a lot of macro expansion is happening, and you may want to investigate.
In the example above we see a TPNF of 7.95, which means that the code size after type-checking is 7.95x larger. This is a case where investigation is a good idea.
Common case: serialization macros
If you see many files with high TPNF numbers you probably have implicit macros that are re-expanded at each use-site. A good workaround is to "cache" the results of such macros in the companion object of case classes and make sure there are no implicits in scope that may re-generate those serialization classes. Zalando's 3x compilation speedup blog post describes this approach in detail and is a great starting point for tuning your Scala build.
Common case: many case classes
In the example above there is another explanation: the high TPNF factor is due to a large number of case classes in a single source file (40 of them). The Scala compiler generates a number of convenience methods for case classes: synthetic apply and unapply methods, a copy with defaults, equals and hashCode, etc.
One workaround is to split such files into several files with a smaller number of case classes -- this would enable Hydra to parallelize the work better, by breaking down a single costly file into several that can be scheduled separately. Moreover, having fine-grained files improves incremental compilation, since changes can be more easily localized by Zinc (the dependency tracker of sbt and most other build tools).
Common case: slow late sources
"Late" source files are source dependencies between workers: in order for each worker to be able to compile its share of sources, it needs some type information from other workers. This is quantified in the Late sources panel:
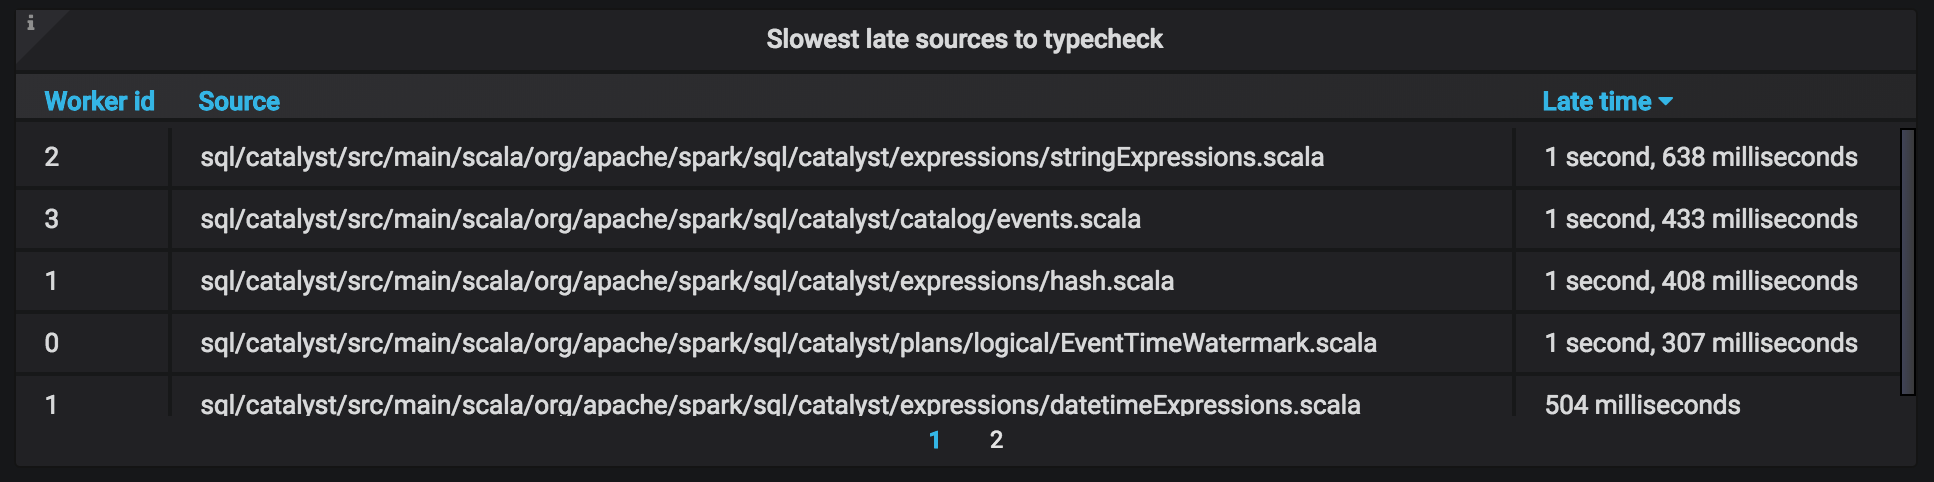
Such files affect Hydra scalability, since some amount of type-checking needs to happen in more than one worker. If you notice files with large type-checking times in this panel you should:
- Add explicit types to all non-private members
- If such files are large, split them in smaller files
Memory requirements
Hydra has slightly higher memory requirements than regular Scala, so make sure you keep an eye on the JVM behavior. We recommend to increase the heap by 5% per Hydra worker.
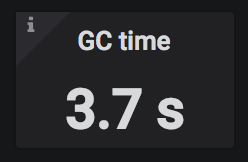
Hydra measures the amount of time that is spent doing garbage collection (GC) during each compilation event, and displays it in the Trends and Insights view. A healthy value is below 20% of the compilation time. If you notice higher GC times it's a good idea to increase the heap size that the JVM can use.
Another warning sign that memory may not be enough is large variability in compilation times. As a general rule the first build will be significantly slower than the subsequent ones. If you notice longer compile times, you may want to increase memory.
Starting with version 0.13.13 of the sbt-launcher, sbt projects can be configured using a file named .jvmopts in the root of your project. To check if your sbt installation supports .jvmopts, just type sbt -help in the terminal:
$ sbt -help
Usage:  [options]

  -h | -help         print this message
  [...]
  .jvmopts           if this file exists in the current directory, its contents
                     are appended to JAVA_OPTS
  [...]
If .jvmopts is part of the output as shown above, you are good. Otherwise, you must update the installed sbt-launcher (download the latest sbt-launcher here). After upgrading, you should finally see .jvmopts in the output.
Now, create a .jvmopts file with the desired settings, e.g.:
-Xmx4G
-XX:ReservedCodeCacheSize=512M
Note that the specific memory settings depends on your project.
StackOverflowError
Hydra may need slightly more stack space than vanilla Scala. If you see this exception simply increase stack size by passing -Xss64m (adjust the value based on your needs) to the running JVM. For sbt you can add this option in your .jvmopts file. Maven users can pass it inside the MAVEN_OPTS environment variable.
It's a good idea to increase the CodeCache memory size as well. This is the area where the JVM keeps the JIT compiled code, so if this space is exhausted the VM may run in interpreted mode, leading to abysmal performance.
Too much GC during compilation
Starting with Hydra 0.9.9 an error is reported if too much GC (Garbage Collection) is detected during compilation. If you see the following error
[info] Compiling 83 Scala sources to ...
[info] Using 4 Hydra workers to compile Scala sources.
[error] Garbage collection overhead above 50%: GC time was 9223 milliseconds out of a total compilation time of  16623 milliseconds. Hint: Increase the heap memory via the `-Xmx` JVM option - https://docs.triplequote.com/user-guide/tuning/#too-much-gc-during-compilation.
[error] one error found
Hydra has detected that more memory is needed to obtain optimal compile times. All you need to do to address the failure is increasing the heap via the -Xmx JVM option (if using sbt, read the previous section for how to give sbt more memory).
Note that the above error message is reported only if the GC time is larger than 5 seconds. If useful, you can tweak the threshold via the system property -Dhydra.metric.gcThresholdMs=<milliseconds>. This feature is disabled if the threshold is set to zero or a negative number.